
Excellence
By: John Vereen
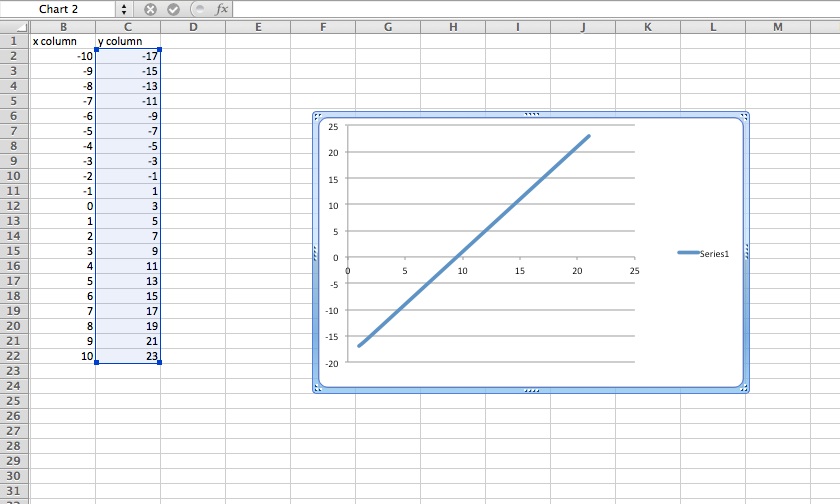
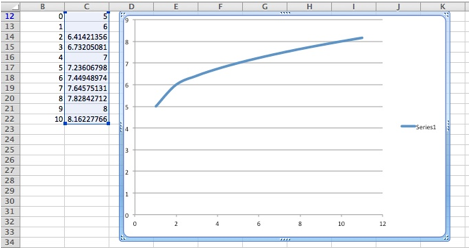
Using
Microsoft Excel, I was able to construct the graph of a linear function and a
square root function simply. Excel is an excellent tool for students and
teachers alike. If my school system I teach in is not a “Google school” or if
they do not provide calculators to all students, then showing students how to
use a computer to graph with Excel will be necessary.
These
pictures show many of the preliminary steps one must take to graph using Excel.
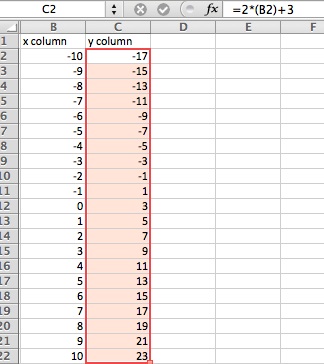
First a student must make an “X-column” displaying the inputs of the graph.
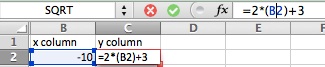
Then in the first cell of the “Y-column”, the student must insert the function
he wants using the fx bar shown
in the second picture and apply the first cell of the “X-column” to the desired
function. After that, the student can use the drag and drop characteristic of
Excel to apply the function to however many inputs that student has in the “X-column.”
Using these techniques, a student can effectively use Excel in order to graph
various functions that they may encounter in their studies.